How to view Engagement survey results over time
Last updated: March 20, 2026
Quick Summary
You can view Engagement results over time from the Overview and Heatmap views. The system uses aggregated data from recent responses to give a consistent trend view across surveys.
Steps
Go to the Overview reporting page.
Click on a KPI, theme, or question to open its score page.
In the Score over time section, select your desired timeframe.

Compare groups over time
Switch to Engagement → Heatmap.
Use Aggregate → Months / Quarters to view trends.
Select the relevant year(s) to refine your analysis.

Common Issue
If results don’t match the survey results you are looking for, check:
Whether “All surveys” is selected
If the data includes responses from a longer / shorter time window
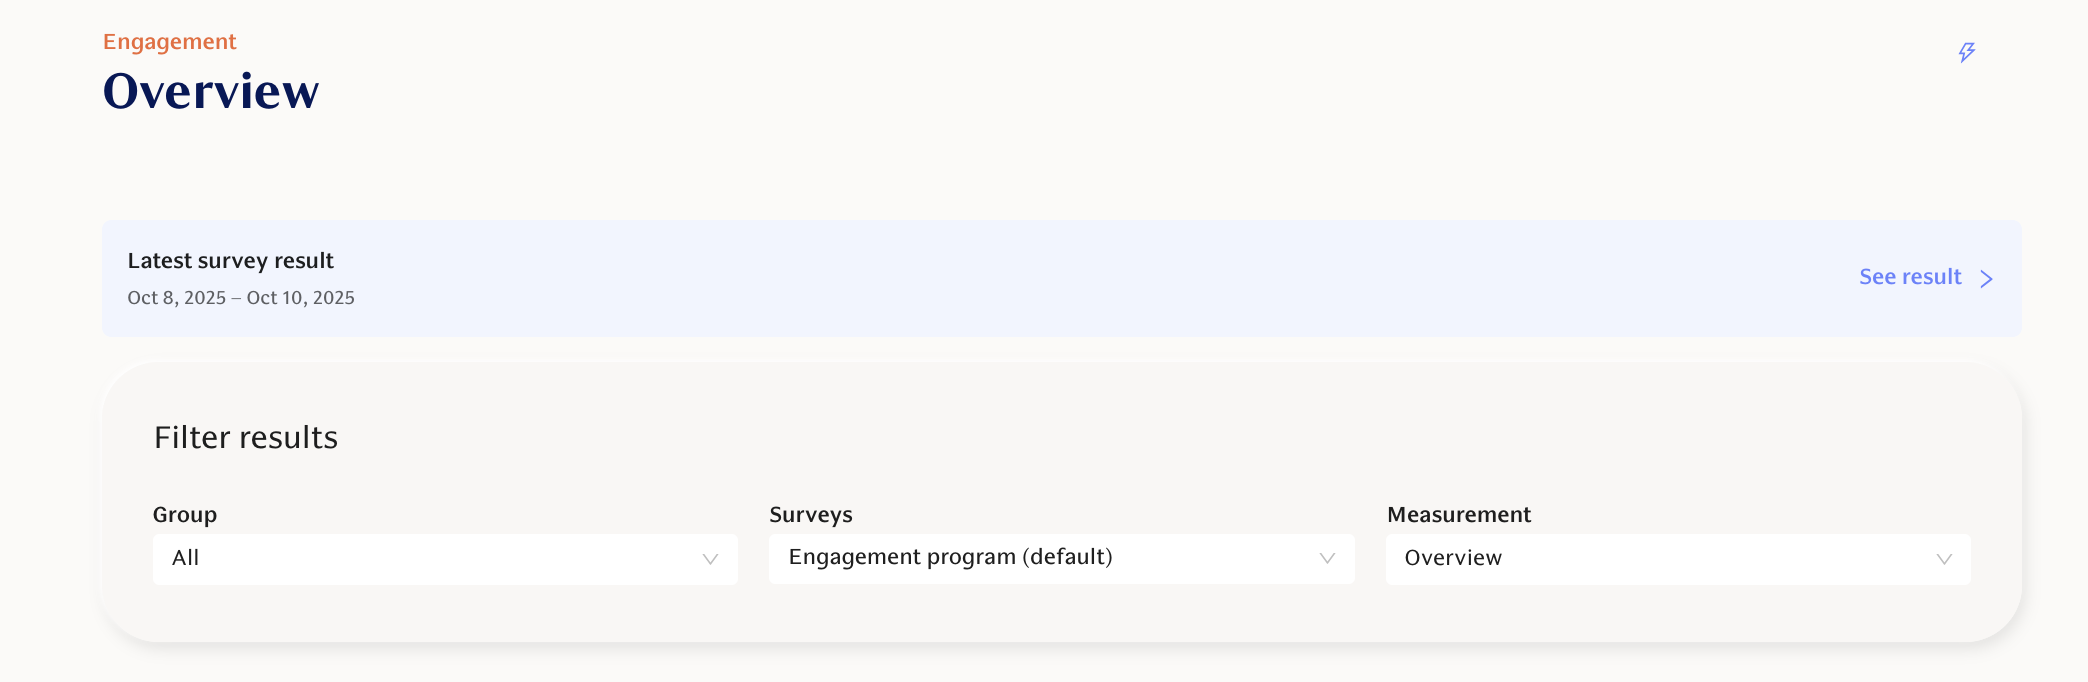
Fix: Use the survey filter dropdown in the “Filter results” section and select a specific survey or survey program.
FAQ
Q: How does the “All surveys” calculation work?
A: It includes each user’s most recent response within a set time window (default 26 weeks), even if they didn’t answer the latest survey.
Q: Why are older responses included?
A: This ensures results reflect actual sentiment changes rather than fluctuations caused by response rates.
Q: Can I view only one survey’s results?
A: Yes, use the survey filter to select a specific survey instead of aggregated data.
Need more help?
Contact support@teamspective.com
How the aggregated calculation works
When you select "All surveys" on the Overview page, the system:
Considers responses from a specific time period (default is 26 weeks)
Uses the most recent response from each user within this time frame
If someone didn't respond to the latest survey, their previous response (within the time window) is included
This calculation method matches the logic used in the Heatmap view and provides a more accurate picture when you have multiple overlapping surveys in your organization.
How to view results over time in Overview
Use the question, theme, KPI score pages to view the Score over time:
Use the Overview reporting page
Click on a KPI, theme or question to enter the score page
Select the timeframe from the Score over time section
How to view results over time in Heatmaps
If you need to see results over time for several different employee groups:
Use the Heatmap view instead of the Overview page
Apply the filter Aggregate → Quarters or Months to see breakdowns across the year
Select the year(s) from the secondary selection
Viewing specific survey results
If you want to see results from only the most recent survey instead of aggregated data:
Use the survey filter dropdown in the "Filter results" section
Select the specific survey you want to view
Look for the "Latest survey result" banner that helps you identify which view you're currently seeing