How are Engagement survey question scores calculated?
Last updated: June 2, 2026
This article helps you understand in technical detail how question scores are calculated in Teamspective.
You can find our article on calculating KPI and Theme scores here:
📄 How are KPI and Theme scores calculated in Engagement?
For a simpler and actionable guide to reading survey results, please view this article:
The Basics
Question scores show how your team responded to individual survey questions. Each score represents the most recent feedback from your team members.
Survey responses are turned into scores between 0 and 100.
The objective is to make all results comparable with each other and reports easy to read. The “best” choice is always rated at 100, and the “worst” at 0. Other response options are distributed equally between these minimum and maximum scores.
Calculation Method - Single survey
When you are viewing a question level result in a single survey, we calculate the scores with this method:
For each person in a group:
1. We find their answer to that question within the survey
2. We use only that one answer—even if they have answered the same question multiple times in the past
To get the final score for the group:
We combine all individual answers from the group
We calculate the average score based on your question scale (e.g., 1-5 scale, eNPS, etc.) and transfer this score to the 0 - 100 scale.
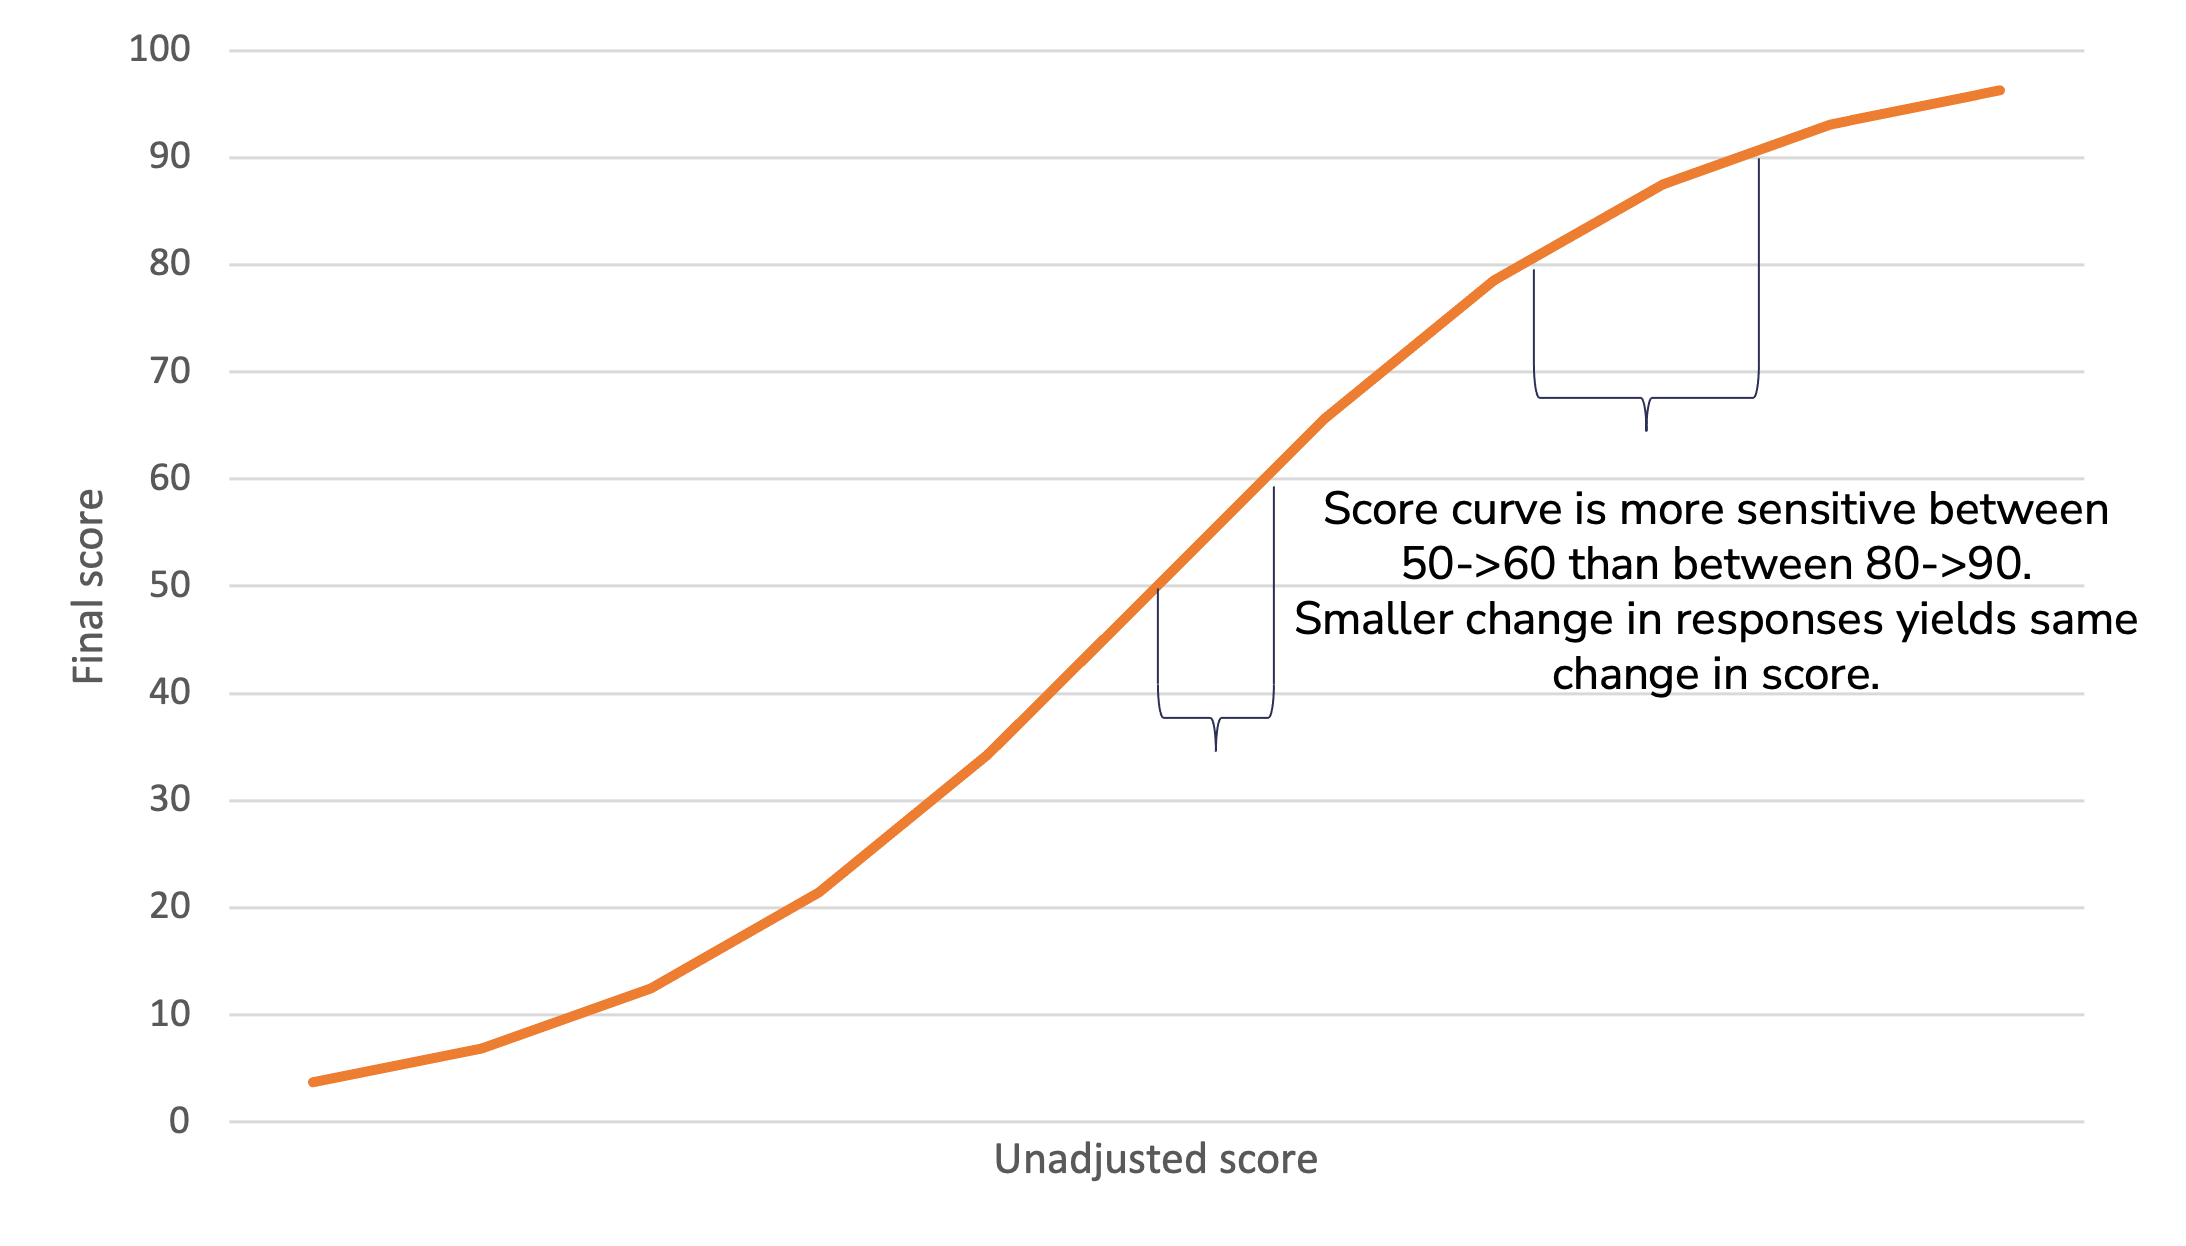
We apply a Logistic curve to highlight changes and differences.
It's common for surveys to generate an answer distribution that has a peak. For example when using a scale from 1 to 5, most responses tend to land around 3-5.
Ability to spot differences and changes is important for the surveys to be useful and actionable. This is achieved by applying a slight logistic curve to the scores.
The curve spreads the peak to a wider area, increasing variation in the scores and making the differences easier to spot. At the same time, the very highest and very lowest scores are more difficult to achieve.
As a result, for example, a change from 75 to 80 is easier to achieve than a change from 90 to 95.
Calculation Method - Multiple surveys
When you are viewing results across multiple surveys (ie. have selected a survey program) we calculate the question level results by default in the exact same way as for single surveys: we display the results from the most recent survey.
However, you have the option of including past responses by adjusting the aggregation window.
Aggregation window for questions
Question scores are calculated from each user’s most recent answer to a question within the aggregation window.
How it works
Our system:
1. Finds the most recent time the question was asked within the survey program
2. Looks back 1 week (default) from that date
3. Includes all answers to that question within that 1-week period
4. Each person contributes only their most recent answer to the question score

When to use different window sizes
- 1 week (Recommended): Best for most use cases. Shows only the freshest data and maintains high sensitivity to changes
- Longer windows (2-4 weeks): Consider if you run many small surveys close together and want to smooth out variations
How to adjust the window
You can adjust the aggregation window for question scores:
workspace level: at Engagement -> Settings -> Aggregation window for questions
survey program level: Engagement -> Customize surveys -> Survey programs -> Edit / Create survey program -> Aggregation window for questions
NOTE: aggregation windows will include answers from former employees if they responded to the question within the set timeframe. Please take this into account when adjusting the duration for the window.
Example 1 - Targeted surveys:
You run several targeted surveys in different parts of the organization during the same quarter. You want the question-level results to take into account the latest answer per employee from all these surveys in the survey program's reporting.
-> Adjust the aggregation window to 12 weeks
-> Teamspective will consider the latest answers by users over this timeframe.
Example 2 - Missing responders:
You are running recurring surveys (e.g. biweekly / monthly) and employees do not always have the chance to respond. Instead of their opinion being dismissed, you want to include the employee's past answer to the same question which was asked a short while ago. In other words, this assumes their answer has not changed.
-> Adjust the aggregation window to XX weeks which is suitable for your situation.
-> Latest answers from employees are included if they answered to the question within the aggregation window.
More examples here:
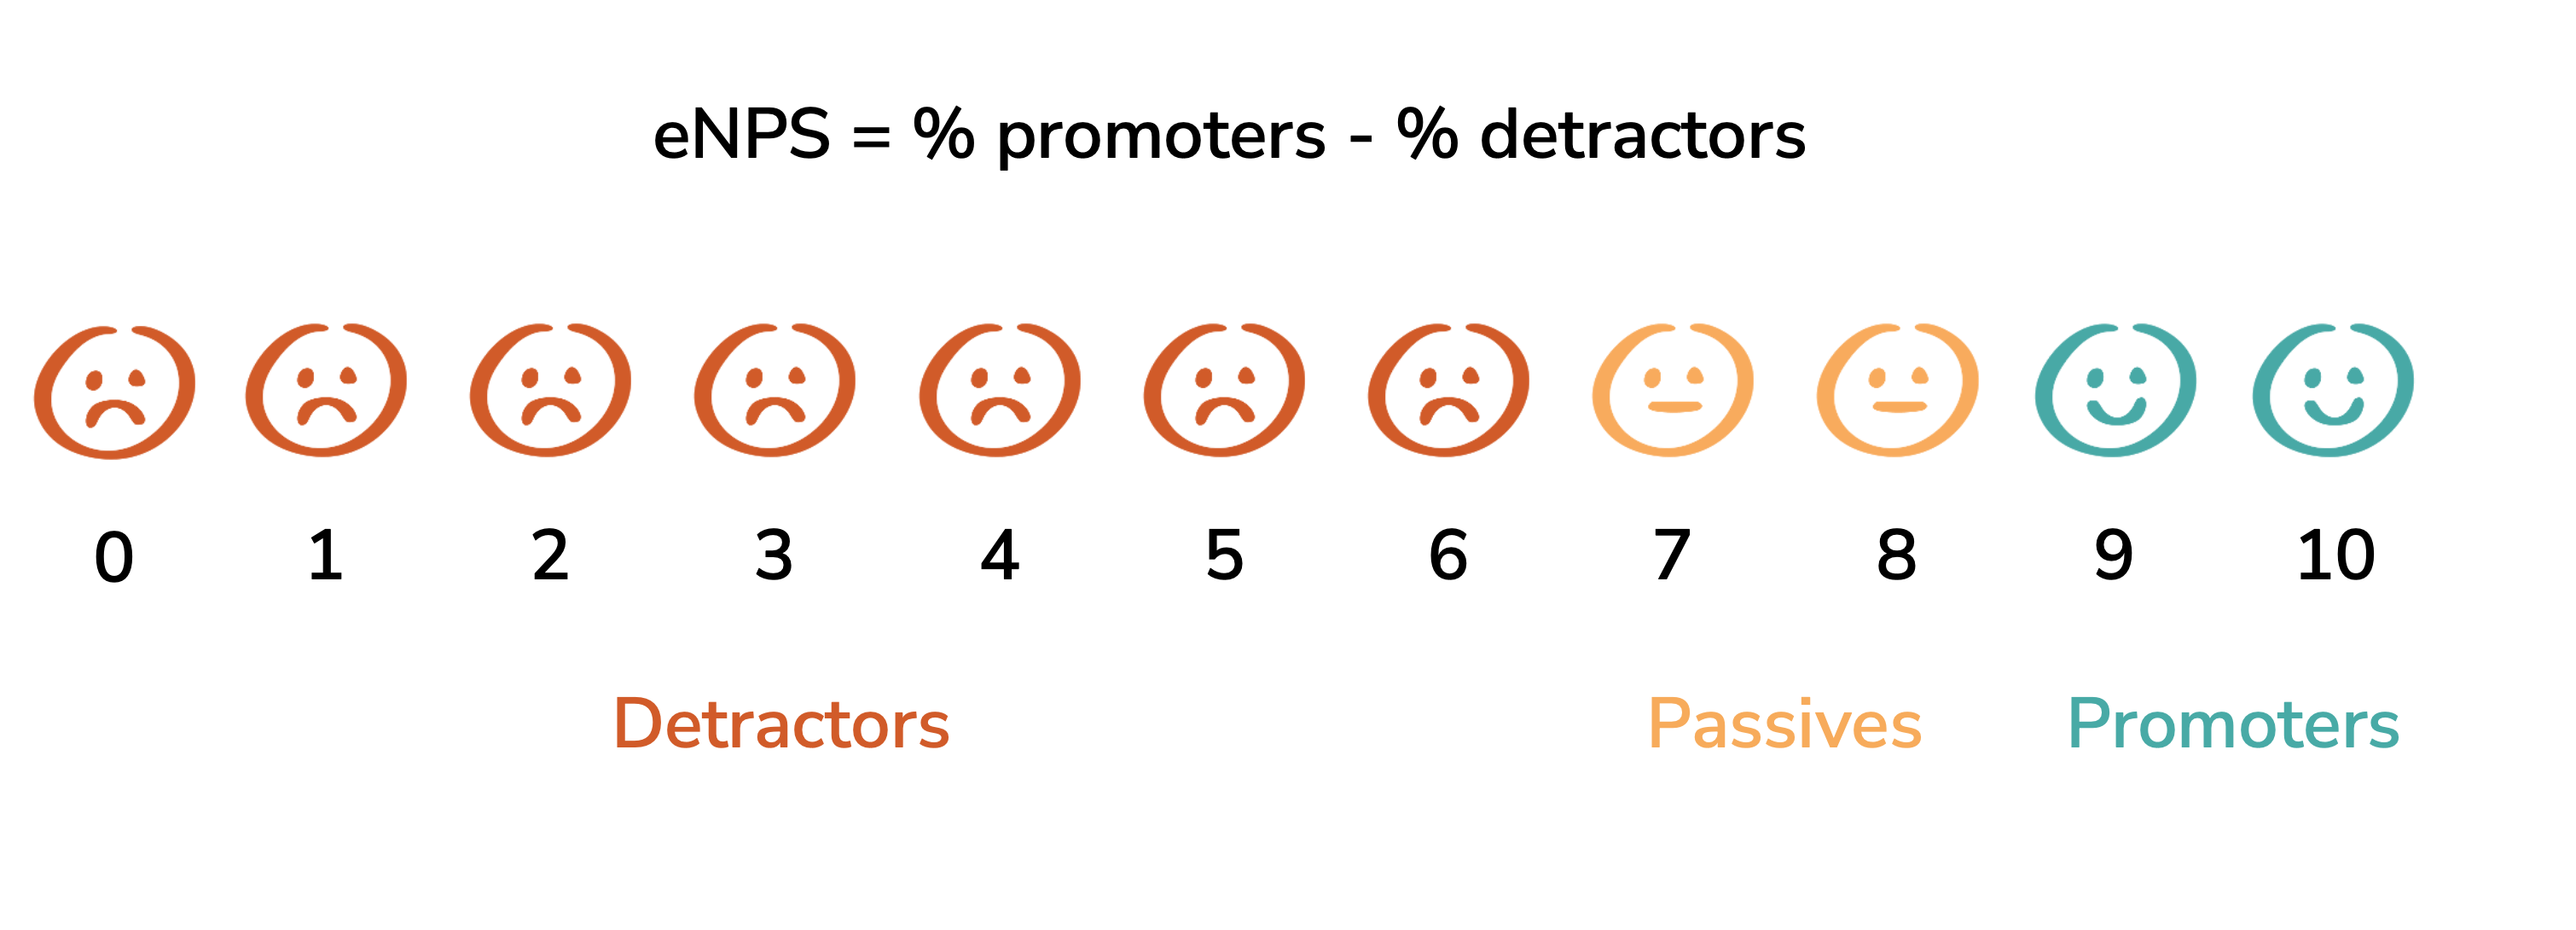
eNPS is different – how is it calculated?
The power of the eNPS question is that it's standardized and thus a comparable metric between companies and survey solutions. eNPS is calculated differently than other Teamspective questions, and the scores can range from -100 to +100.
eNPS is the percentage of “promoting” minus the percentage of “detracting” employees as measured by the question “On a scale of 0-10, how likely are you to recommend your organization as a good place to work?”.
Promoters are those answering with a 9 or 10, detractors answer with a 6 or below. Other responses are only counted in the total sum of responses.
Example of how an eNPS score of 39 is calculated:

Usually an eNPS score of 0 or higher is considered acceptable. That means that the number of employees scoring 9 or 10 is higher than number of employees scoring 0-6.
Scoring 20 or higher is a good result, and the best high performing companies usually score 50 or higher.
Including eNPS in Theme scores
Although eNPS scores are calculated on a different scale, you are able to include eNPS into Theme scores. When eNPS is added to a theme, we perform these steps to make the question level scores comparable before calculating the theme score:
Calculate eNPS score according to eNPS calculation logic
Convert the -100 - +100 scale to 0-100 with this formula:
(enps + 100) / 2Calculate theme score by averaging the question scores belonging to that theme
Key Differences: Questions vs. KPIs/Themes
Aspect | Questions | KPIs/Themes |
Default Window | 1 week | 26 weeks |
Window Type | Question-based: when was this specific question last asked? | Survey-based: when was the latest survey published? |
Default Aggregation Approach | Shows recent snapshot per question | Combines data across multiple surveys |
Sensitivity | High—responds quickly to changes | Moderate—provides stable trends |
Best For | Tracking specific, immediate feedback | Monitoring trends and overall engagment |
FAQ
Q: Why do my question results differ from my KPI results?
A: Questions use a 1-week window by default, while KPIs use a 26-week window. Questions show recent data, while KPIs show a more stable trend over time.
Q: Do former employees affect my results?
A: Yes, if they answered within the aggregation window. This provides historical continuity and prevents sudden score drops when team members leave.
Q: What happens when someone answers the same question multiple times within the aggregation window?
A: Only their most recent answer within the aggregation window is used. This prevents double-counting and ensures data accuracy.
Need more help?
Contact support@teamspective.com